If you are not yet utilizing GA4 explorations to gather more insights into your web data then chances are high that you are doing an injustice to your marketing campaigns and strategies.
Look;
I agree that you might have a marketing strategy for running your campaigns either at an individual or organizational level.
But the bottom line here is;
In this era who would ever want to miss on critical aspects that are foundational to data-driven decision-making?
In fact, let’s face it.
No one desires to just spend more on a marketing budget and fail to generate the desired results.
It is for this reason that, this guide strives to help you know and use different Google Analytics 4 explorations.
Here’s what you should expect:
- Google Analytics 4 Explorations (Simplified Definition)
- Importance of Google Analytics 4 Explorations
- Standard Versus Exploration Reports
- Types of Exploration Reports
- Step-by-Step Exploration Report Creation
- Limitations of Google Analytics 4 Explorations
Let’s jump in.
What Are GA4 Explorations?

GA4 explorations refer to a collection of advanced discovery and comparison tools used to derive insights into an e-commerce store or website’s performance.
Unlike conventional reports in Google Analytics, explorations pull raw user interaction data and present them in a way that you can draw specific insights from it.
But that’s not all;
Explorations offer additional customization options such as comparing segments, data visualization, user journeys, and other meaningful patterns
Why GA4 Explorations Matter

Some of the benefits of Google Analytics 4 explorations comprise:
Numerous options to customize data
You get to customize standard reports hence simplifying attribution and interpretation process.
Additional data visualization features
Google Analytics 4 explorations go beyond basic visualizations such as tabular and time series. They incorporate additional visualization techniques such as scatterplot.
As a result, you can explore data in different ways and uncover insights beyond conventional parameters such as views and event counts.
Improved data consistency
Traditionally web data analysts used to create individual customizations on standard reports, especially in situations where large data is analyzed by different people.
Explorations make it easier to create a specific version of standard reports based on your business needs through which others within the GA4 property can reference.
Consequently, it becomes easier for others to use the same data at the departmental level.
Increased efficiency
Explorations enhance standard reports based on business needs making it easier to share such reports with other users who can access the Google Analytics 4 property.
Standard Versus Explorations Reports

Here’s what you should know;
Standard reports offer predefined structured insights that align with a set of metrics and dimensions for simple and common analysis.
On the other hand;
Explorations come with extra features including flexibility and capabilities for ad-hoc analysis.
This makes it easier for users to interact and explore data to answer specific questions and discover new insights.
Types of Reports in GA4
They include:
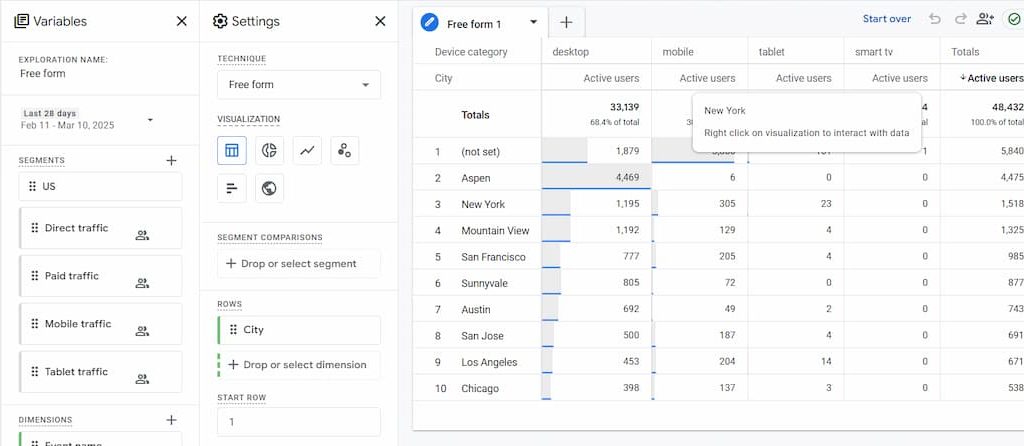
Free Form Exploration
This is the default type of exploration and comes with additional visualization techniques such as line plots, geographical maps, scatter diagrams, and bar graphs.
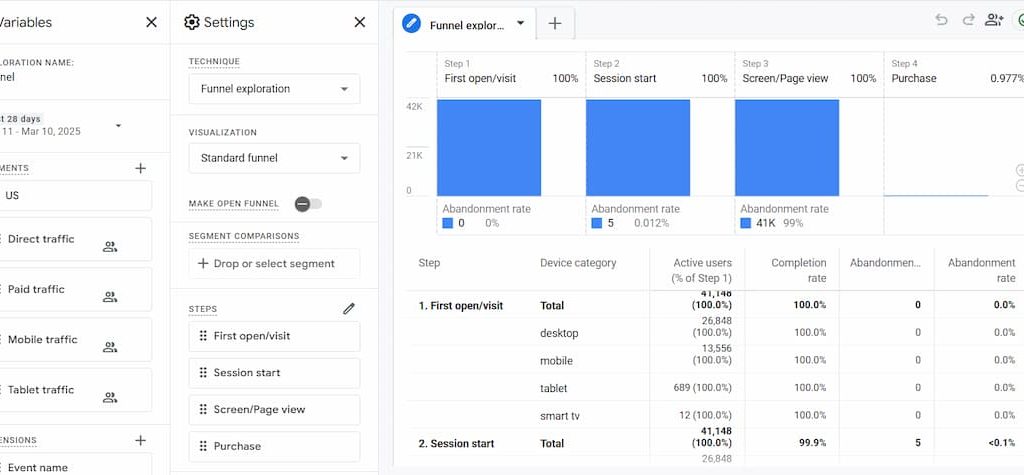
Funnel Exploration
This type of exploration helps you visualize the user journey in completing tasks and identifying ways to improve user experience.
It can also help you analyze abandonment and completion rates along a selected user journey.
With this approach, you can identify bottlenecks in selected paths and improve user experience, especially in areas where users are experiencing difficulties.
By the way;
There’s the open and closed funnel.
In brief;
In an open funnel, users are included at any step along the funnel whereas in a closed funnel, users have to start from the first step to be included.
To understand this concept better let’s assume your funnel has three steps 1, 2, and 3.
In an open funnel case, a user can enter through the funnel at ‘Step 2’ and still be recognized/ included in the funnel.
On the other hand, in the case of a closed funnel, the user MUST start from ‘Step 1’ to be included in the funnel.
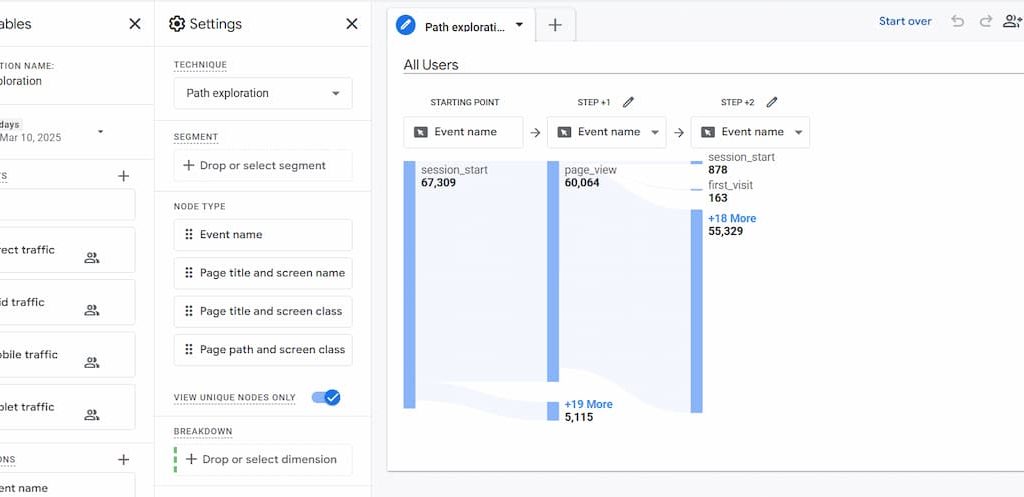
Path Exploration
In my experience path exploration is common or popular in displaying user interactions/ behavior on your website.
Let me explain.
Path exploration helps in visualizing:
- Where users go after the first session
- Loops where they get stuck
- Common backward and forward paths in funnels
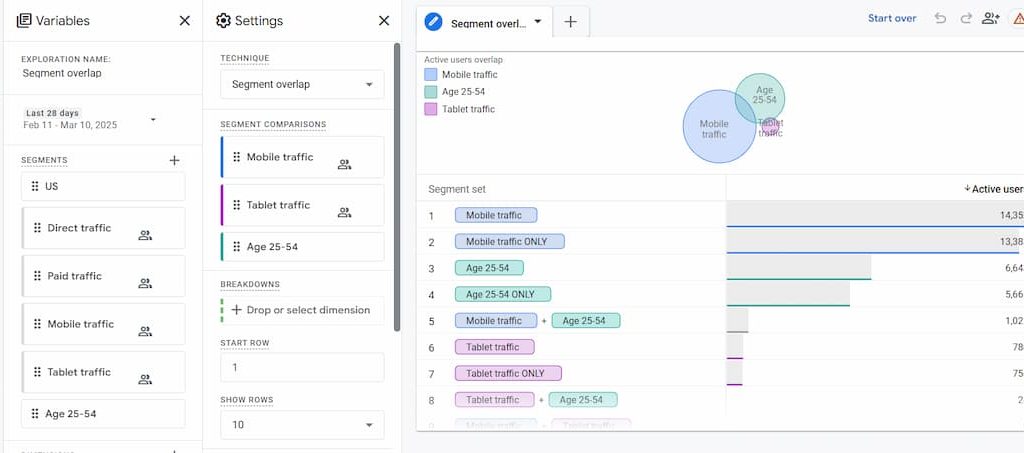
Segment Overlap
The segment overlap exploration is commonly used when comparing up to 3 user segments.
Take note that in this case, user segments can be cart abandoners, organic visitors, mobile users, users based on specific regions, etc.
With Segment Overlap, you can:
- Visualize user interactions based on different segment combinations
- Discover and create new segments that will be crucial to your Google Analytics reports
- Identify and validate user persona characteristics
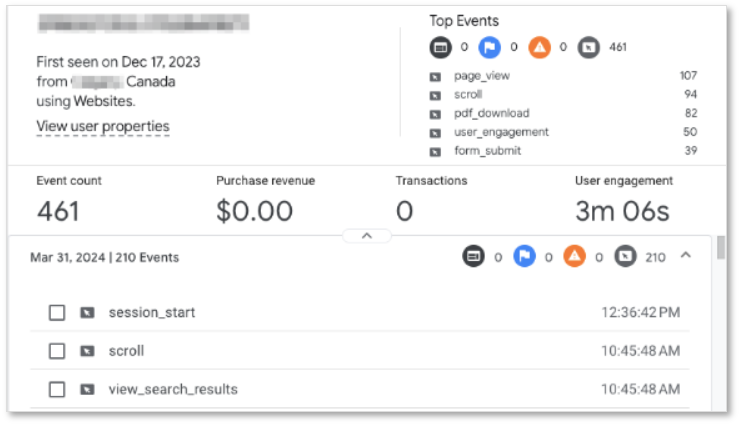
User Explorer
User exploration displays detailed user interactions on your website.
You can use it to:
- Troubleshoot individual user flow
- Extend user journey for specific users such as the ones with a high average order value
- Determine user activity across different devices
Note;
User exploration has only two available dimensions (stream name and effective user ID).
Effective user ID contains client ID, User ID, or app instance ID.
In instances where you have set your reporting identity to ‘By Device Only,’ the User ID will not reflect in the dimensions section even if you are tracking it.
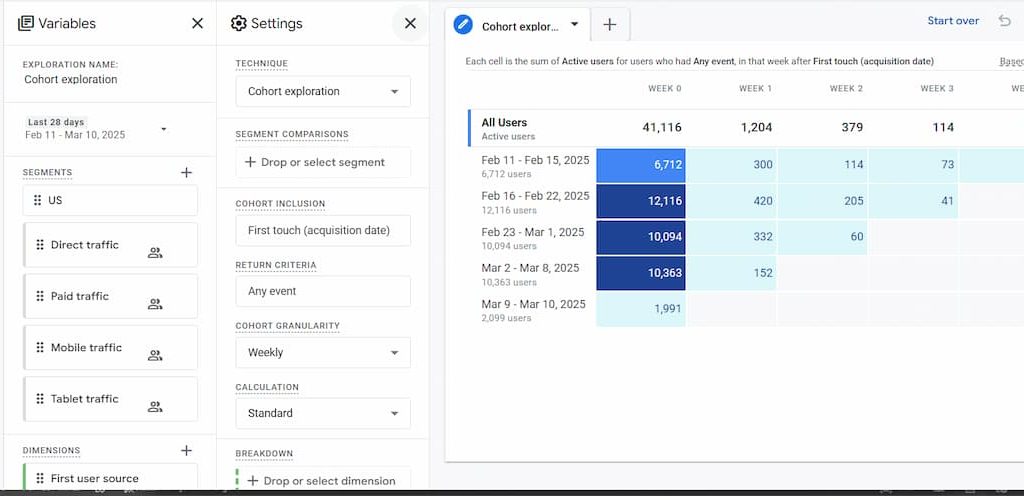
Cohort Exploration
Cohort explorations display the performance of a group of users who present common characteristics or behaviors.
You can use cohort explorations in
- Displaying data on retention time
- Tracking performance of specific parameters such as behavior and engagement metrics based on user device.
- Comparing user performance based on common factors such as specific newsletters vs. those who did not read the newsletters.
I usually use cohort exploration to garner additional insights into user retention.
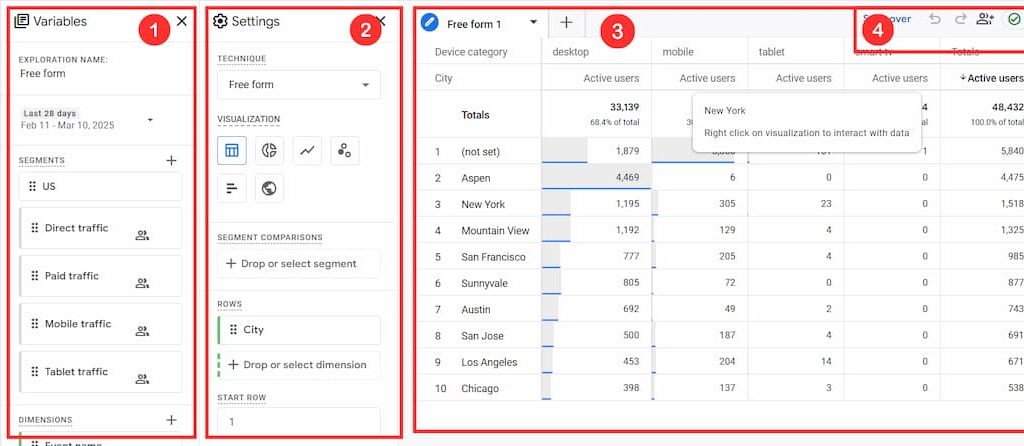
Explorations Dashboard Setup
Overview
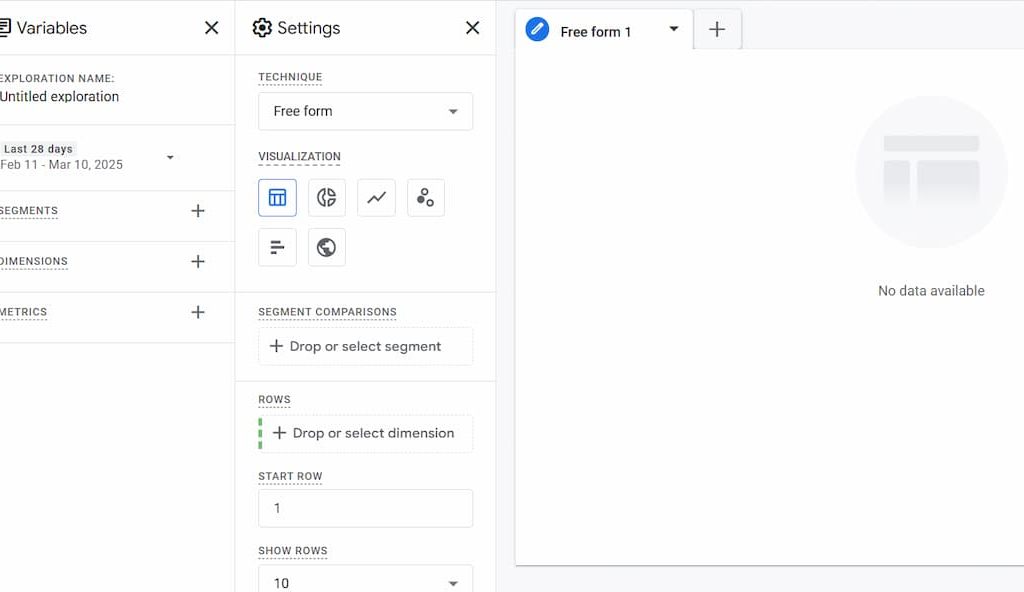
The GA4 exploration interface is made up of 4 main sections. They consist of:
- Variables: most of the elements in this section are consistent across all explorations.
- Settings: this section consists of elements that are specific to the type of exploration.
- Output & Tabs: data populates in this section and you can be able to view the result of a specific exploration.
- Toolbar: contains additional components associated with data management and sharing
How to Create an Exploration Report
Step One: Navigate to the left-hand menu and click on ‘explore.’
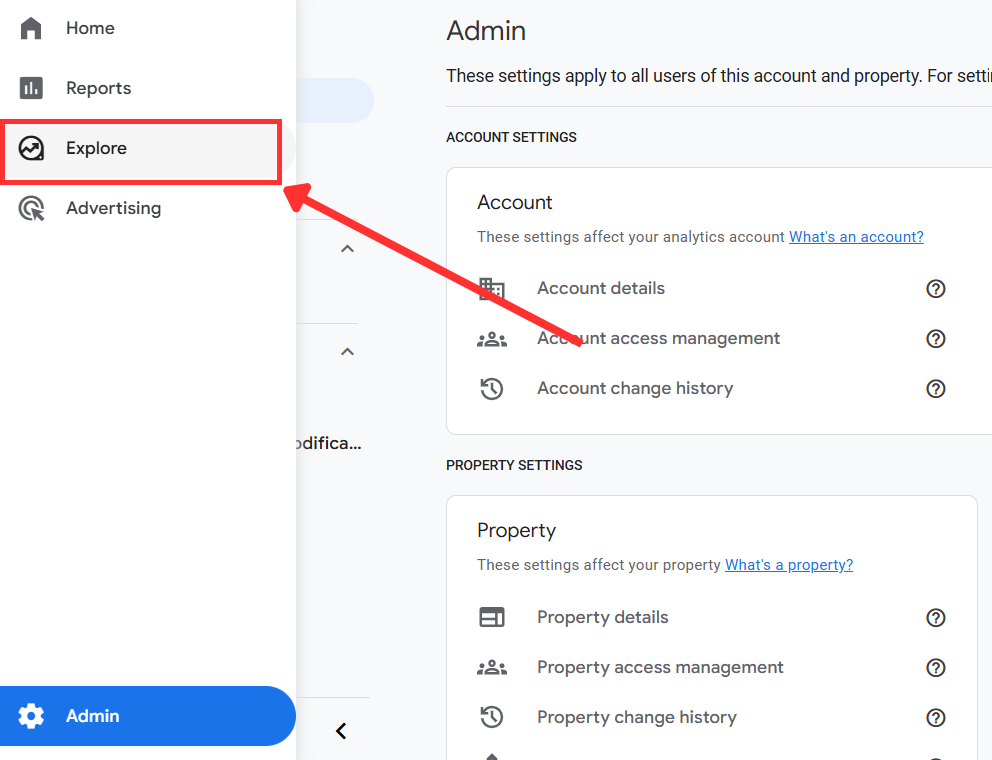
Step Two: Select your preferred type of exploration. Use the navigation button to scroll to other additional types of exploration.
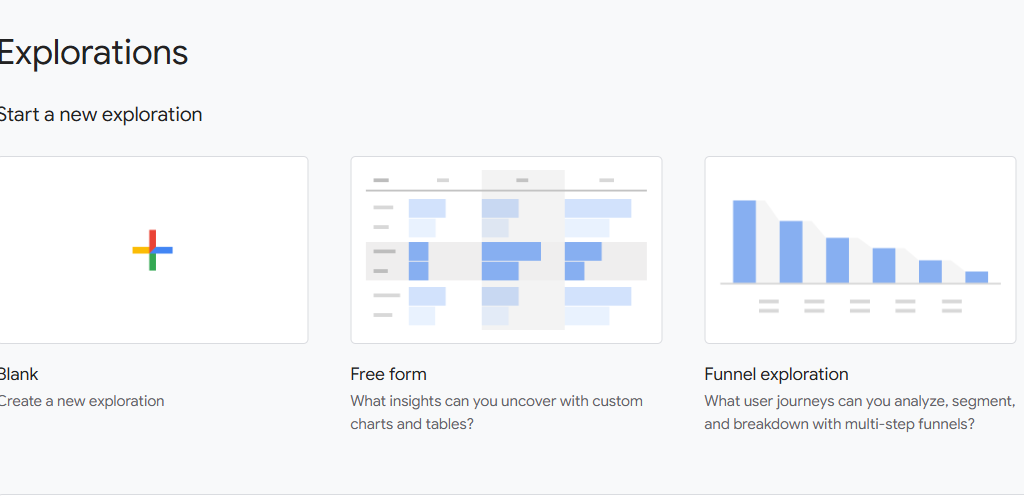
By default, Google Analytics 4 picks Free Form Exploration.
What Are the Limitations of Google Analytics 4 Explorations

Even with the multiple benefits that GA4 explorations come with especially when compared to standard reports, there are some limitations that I have experienced while using them.
Here are some:
Limited qualitative data
Google Analytics 4 explorations are rich in providing quantitative data about user interactions but fail to provide additional qualitative data.
I know you might be wondering;
“What’s the essence of qualitative data in this case?”
Here’s the deal;
Pairing both qualitative and quantitative data helps you to fully understand user interaction patterns and their motivations as well as their frustrations.
To solve this problem, you can opt for other third-party tools such as Hotjar Surveys which help you collect user feedback.
Limited Visualizations
From my experience;
Google Analytics 4 offers far better visualizations than Universal Analytics.
However, there are several instances where the visualizations might not be appealing to non-analysts.
As a result, they might need additional support when interpreting the data.
To solve this problem, you will need to connect the GA4 data with visualization tools such as Looker Studio (formerly known as Google Data Studio).
Limited number of explorations per user
Google Analytics 4 allows you to create at most 200 explorations per user within the same property and up to 500 shared explorations per property.
It’s also worth noting that you can’t resize columns of a report.
To Some Up…
Leveraging GA4 explorations can bring out the difference in your web analytics especially for e-commerce businesses. You will be able to understand, user journeys, and interactions, evaluate product performance, and even analyze the effectiveness of different campaigns. For a practical implementation of the aforementioned explorations and other web-tracking services Reach Out.
ALSO READ
The SECRET Behind GA4 Attribution Models (Basic to Advanced Guide + BONUS Info on DDA)
What Most Beginner Guides to GA4 Event Tracking are Missing Out (Detailed Explanation)
I Investigated Over 300 UTM Tracking Applications Here’s What I Found Out: A Comprehensive Guide
Phone Call Tracking in Google Analytics 4: The Lazy Man’s Ultimate Guide